The vmstat program is a tool for displaying information about virtual memory usage and is part of the procps suite of utilities. The procps package provides tools for browsing the /proc file system. The /proc filesystem is “psuedo” file system that is created and stored in memory. The /proc filesystem provides an interface to the running kernel data structures. Most files in /proc are readable by any user account. Most files are also only readable but there are a few files that the root account can write to. According to the man page vmstat makes use of the following /proc files:
- /proc/meminfo – This file holds information about memory usage on the system. Aside from being used by vmstat, meminfo is also used by the free program. For a complete listing of what each line in this file mean see man 5 proc.
- /proc/stat – This file list kernel and system statistics. The contents of this file depend upon what version of kernel you are using. For a listing of what entries may be in here and what they indicate see man 5 proc.
- /proc/*/stat – /proc/[pid]/stat shows status information about the specified running process. See man 5 proc for a list of what may be in this file.
- /proc/slabinfo – This file contains information about kernel caches. This file is only readable by the root user and while you can view the information in vmstat, you must run vmstat with elevated priviliges should you elect to report the slab information. See man 5 slabinfo for more information.
Virtual memory is a memory management technique that, to the system, provides more memory than is actually available. Instead of a one-to-one addressing of processes to physical memory, the Operating System maintains a virtual table space where “pages” of virtual memory are allocated to processes. These pages are mapped to a physical memory via a page table. This physical memory can be RAM or more slower allocated disk storage like a swap partition or swap file. To best maximize system memory, the Kernel attempts to allocate physical RAM to active processes while moving inactive process to virtual memory. That is, an inactive program may have its page moved to the swap partition. Moving data from RAM to virtual memory can be done by either paging or swapping. Swapping is when an entire process is transferred from physical memory to virtual memory. Paging is when portions of a process are written to virtual memory. A page-out is the writing of the “page” to virtual memory and a page-in is reading the “page” from virtual memory. Paging is normal behavior for a system, but excessive paging can cause problems, especially excessive page-outs. If the tasks assigned to your system exhaust the physical RAM for all active processes, the Kernel may need to push some active process pages out to virtual memory slowing the performance of the system significantly. Using a tool like vmstat can provide valuable insights into the health of your system and help ferret out performance problems.
Executing vmstat by itself prints out one a summary of information based upon the last reboot of the system. The information is presented in a table format:
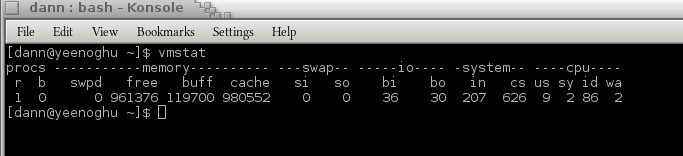
vmstat default output
The first line details the category of information detailed in the columns below:
- procs – Process information – information about processes running on the system:
- r = The number of runnable process that are running or waiting for run time. A “runnable” process is a process that is waiting for the CPU to run. The schedule determines what runnable process to send to the CPU.
- b = The number or processes in uninterruptable sleep. A process that is in uninterruptable sleep is waiting on hardware conditions to be able to complete. While in this state they cannot be interrupted.
- memory – memory information – information about physical and virtual memory:
- swpd = The amount of virtual memory used, that is block or disk storage that is used for memory
- free = This is the amount of idle memory in the system. Idle memory is memory that is no longer used by a process by still has information in it. Idle memory has not yet been reclaimed.
- buff = The amount of memory being used as buffers. Buffers are raw disk blocks that store information from a process not related to file data. Information like permissions, file location, etc. are stored here.
- cache = The amount of memory being used for cache. Cache stores file data information for a process.
- swap – swap informtaion – information about the swap file/parition usage
- si = The amount of memory (pages) swapped in from disk.
- so = The amount of memory (pages) swapped out to disk
- io – input/output information – information pertaining to data transfer between block devices
- bi = Blocks in received from a block device (disk)
- bo = Blocks written out to a block device (disk)
- system – system informtaion – basic overall system information:
- in = Number of interrupts per second, including the clock interrupt. An interrupt is a signal by a hardware device or process that demands the CPU stop whatever it is currently processing and switch attention to the device or process raising the interrupt.
- cs = Number of context switches per second. A context switch when the CPU stops and stores the state of a process to be restored at a later time or when a stored process is returned to active state to continue executing the process.
- cpu – CPU information – information on process utilization of the CPU
- us = This represents time spent running non-kernel code. This is the time the CPU spends running applications started by a user or called by an application started by a user. This is non-system call related processing.
- sy = This represents system time. System time is time the CPU spends running system calls, calls related to the time the kernel is utilizing the CPU.
- id = This represents idle time. Idle time is time the CPU is not currently processing a request. This does not mean there are no processes running, just that no process is requiring the CPU. This counter does not include i/o wait.
- wa = This represents CPU Wait time where the CPU is waiting for I/O to complete.
This is the default reporting for vmstat. What gets reported and how can be altered with switches, which will be covered shortly. As stated calling vmstat by itself prints out a summary of system information from the last reboot. Two values can be passed to vmstat. The first it a delay in seconds and the second is a count, the number of cycles vmstat will run for. If you only specify the delay value vmstat, that is no count, vmstat will continue to report indefinetly. Specifying delay and/or cycles changes the reporting values from the last reboot to report the values reflecting the time between the last cycle. The value for delay and cycle must be a postive integer.
vmstat 2 5
This will cause vmstat to report statistics every 2 seconds for 5 intervals. The first report will reflect statistics from the last reboot. Each subsequent report will contain the statitics on the previous 2 seconds, the duration between cycles.
The -S, or –unit, switch changes the default output values from KB (1024 bytes) to one of the following:
- k 1,000 bytes
- K 1,024 bytes
- m 1,000,000 bytes
- M 1,048,576 bytes
Changing the unit will not effect the output of si, so, bi, and bo.
While vmstat is running it is smart enough to re-print the header if the values increment enough to cause the header to scroll off the screen. This behavior can be suppressed with the -n, –one-header, switch.
The -a, or –active, switch will show active and inactive memory information. This will introduce two new fields that replace the Memory Buffer and Cache statistics:
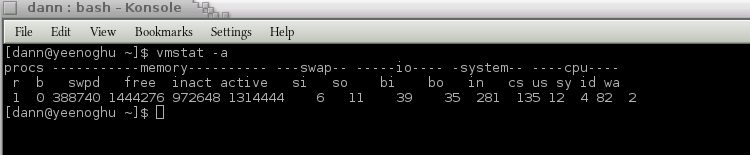
vmstat -a output
Memory
- inact = Reports inactive page. An inactive page is a page that is no longer in use. Inactive pages can be in one of three states:
- Dirty – This is a page that is no longer in use but has data that has been changed and needs to be written to disk.
- Laundered – This is an interim state for a dirty page where it is having the contents moved from memory on to disk.
- Clean – This is a state where either an inactive page does not have changed data or a dirty page has completed the laundered phase. Clean inactive pages can be deallocated.
- active = The amount of pages in memory that are currently in use.
The -s, or –stats switch will output a table of event counts and statistics:
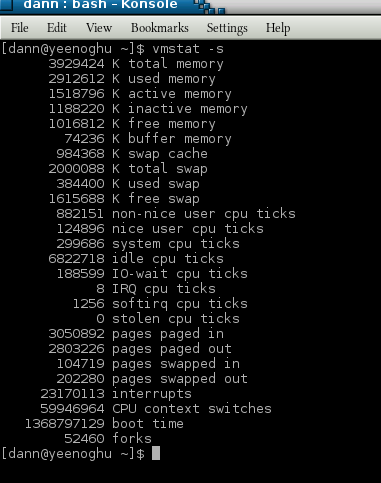
vmstat summary report
This display cannot repeat so neither a delay or cycle value will be accepted. The information reported is essentially the same information gathered from the default output just in a more user readable format. Note that some of the statistics are broken out in more detail in this format whereas they are added together in the default reporting. For instance, the default output combines both nice and non-nice user cpu time into just user time whereas the –stat view breaks these values out.
The -d, or –disk, reports disk statistics, replacing the default memory, system and cpu statistics:
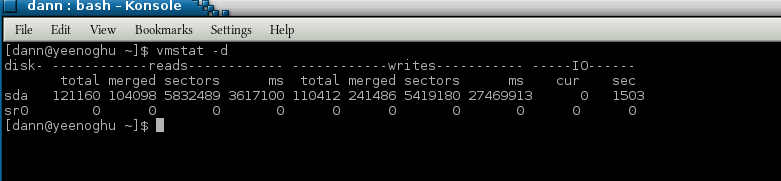
vmstat -d output
The report details the following:
- Reads
- total = This is the total number of successful reads completed from the disk.
- merged = This is the total number of grouped reads that resulted in one coplete I/O.
- sectors = Sectors is the total number of sectors that were read successfully.
- ms = The total number of milliseconds spent reading.
- writes
- total = Total number of writes completed successfully.
- merged = Total number of grouped writes completed successfully resulting in one I/O.
- sectors = Total number of sectors written successfully.
- ms = Total number of milliseconds spent writing to the disk.
- IO
- cur = Reports any I/O currently in progress.
- s = Reports any seconds spent for I/O.
Disk information is reported on a per block device basis. Partition information can be listed with the -p, –partition, switch and specifying the device:
vmstat -p /dev/sda1
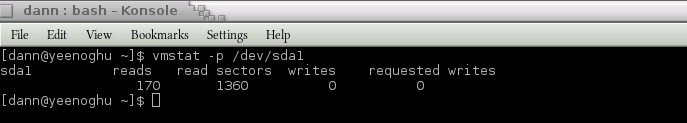
vmstat partition report
Again, the default output is replaced with a report on the partiton listed:
- reads = Total number of reads completed successfully from this partition.
- read sectors = Total number of sectors successfully read from this partition.
- writes = Total number of successful writes to this partition.
- requested writes = Total number of write requests made to this partition.
Like the standard report, the disk report has a summary view reported using the -D, or –disk-sum, switch:
vmstat -D

vmstat disk summary report
The report is a summary of the information for all disks connected to the system. Like the –stat view, the –disk-sum report will not accept the delay and/or cycle value.
The -f, or –forks, switch will display the total number of forks since the last reboot. This values includes to sum of the following totals:
- Forks = A fork call that duplicates a current process. This child process gets a new PID and has the it’s parent PID set to the PID of the process it forked from.
- Vfork = Similar to a fork, when a process creates a Vfork, the process the Vfork was created from is temporarily suspended until the child process exits.
- Clone = A clone is similar to a fork but a clone allos the new process to share part of the execution context with the calling process.
The –forks switch does not accept delay or cycle values.
Vmstat has the ability to report on slabs using the -m, or –slabs, switch. A slab is a memory managment mechanism for allocating kernel objects and is used by the kernel in controlling cache. This switch can only be used by an account with elevated privileges:
vmstat -m
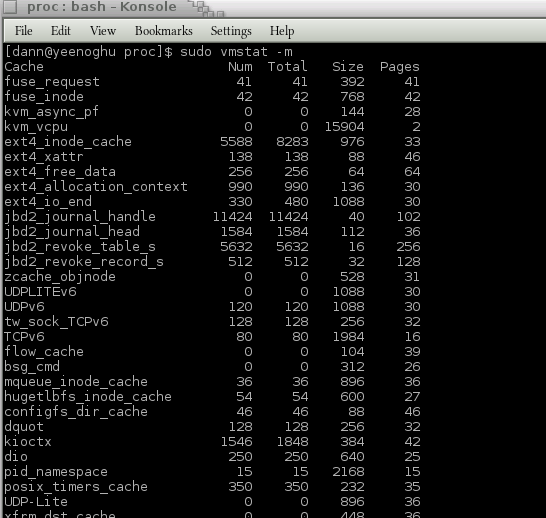
vmstat slabinfo report
The output is a less verbose summary of the /proc/slabinfo file:
- Cache = Name of cache being reported.
- num = The number of currently active objects in this cache.
- total = The total number of available objects in this cache.
- size = The size of each object in the cache.
- pages = The total number of pages with at least one active object associated with this cache.
The –slabs switch does not accept delay or cycle values.
The vmstat tool is a handy utility for reporting on your systems virtual memory use and will give you some statistics on disk storage. This is a handy tool for helping uncover performance issues on a Linux system.
Bibliography
- man vmstat
- man 5 proc
- man slabinfo
- Wikipedia Page on vmstat
- The Linux Documentation Project: processes
- StackOverFlow: Linux Memory Buffers vs Cache
- Linux HowTos: Linux System Memory
- TheGeekStuff: linux memory management
- Linux Journal – monitoring memory management with vmstat
- Wikipedia article: interrupt
- Wikipedia Article: context switch
- xing.com – cpu times
- Centos Documentation – memory
- Redhat Magazine – Understanding Virtual Memory
- StackOverFlow: Difference between fork, vfork, exec, and clone
- Unix Foo: What is /proc/slabinfo
- Wikipedia Article: Slab Allocation
If the video is not clear enough view it off the YouTube website and select size 2 or full screen. Or download the video in Ogg Theora format:
- Episode 030 – vmstat Ogg Theora Video – Archive.org
Thank you very much!
- Ogg file hosted by Hacker Public Radio
- Speex file hosted by Hacker Public Radio
- Mp3 file hosted by Hacker Public Radio