The Apache BenchMark tool is a handy application to have in your toolbox that can perform a number of helpful tasks. First, the primary use for the tool is to simulate how your server may react under maximum load. Because of this, if you are experiencing intermittent issues with your HTTP server you may be able to force failures or errors by increasing the load against your server using Apache Bench Marking tool. Be aware, though, that this tool primarily reports requests per second of a single page and is not necessarily indicative of how a typical user may interact with your site.
The Apache BenchMark tool is included with the Apache software but may be available in your distrobution under the Apache-Utils package. You do not need to have the Apache Web Server running on the machine you want to run AB against and you can run it against any HTTP server, not just Apache. Only run this tool against a web server that you have permission to test. Running this tool against any website you desire can get you into trouble. Finally, you should not run AB on the same system that you are load testing against.
The Apache BenchMark tool’s executable is ab. The only parameter required to be passed to ab is the webpage you want to bench mark:
ab http://www.thelinuxlink.net/index.php
This will execute AB against the web server hosting the domain www.thelinuxlink.net and target the page index.php. This test is not very stressful as it will only perform one request against the server. You can specify the number of request you want to make with the -n switch:
ab -n 500 http://www.thelinuxlink.net/index.php
This will send 500 requests to the web server one at a time. Again, not very stressful against the server you want to benchmark. To really begin to stress the system include the -c, option which defines the number of concurrent connections per request:
ab -n 500 -c 100 http://www.thelinuxlink.net/index.php
This will again perform 500 requests to the index.php but instead of one request at a time will process up to 100 requests concurrently. This does not mean that it will process 100 concurrent request 500 times. To achieve that test you would have to run this command:
ab -n 50000 -c 100 http://www.thelinuxlink.net/index.php
Before continuing on to some of the other switches ab will take we should probably analyze the output of the command:
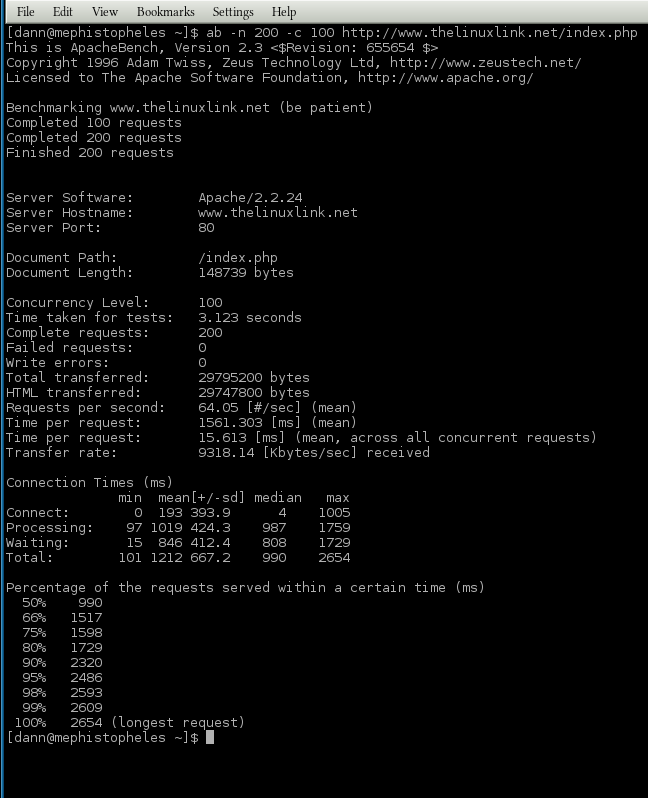
Apache BenchMark output example
Here is a break down of the sections:
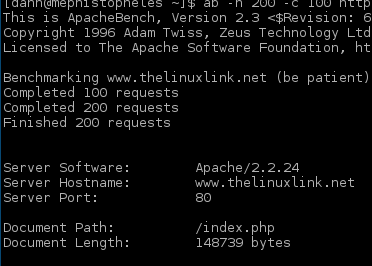
Apache BenchMark Server Summary
As ab runs it will indicate progress after each 10% or 100 (minimum value to trigger) requests of the total requests are made. Once the total number of requests have completed the summary results are displayed. The first five lines display some information about the environment being tested:
- Server Software – The name or the webserver software and the version if reported.
- Server Hostname – The hostname or domain name of the server benchmarking.
- Server Port – The port the benchmark connected to the server with
- Document Path – The path to the document you are connecting to.
- Document Length – The size of the document
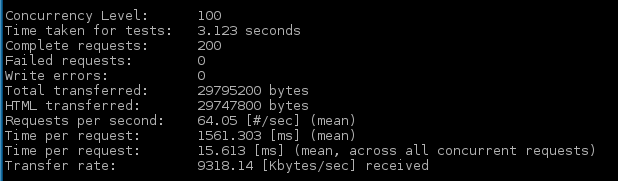
Apache BenchMark Test Summary
The section of information details the test that was run:
- Concurrency Level – The number of concurrent requests made at one time.
- Time Take for Tests – The overall time it took for the whole benchmark to complete.
- Complete requests – Total number of successful responses to the requests.
- Failed requests – Total number of unsuccessful responses to the requests. If this number is greater than zero further information will be presented showing the number of requests that failed due to connecting, reading, incorrect content length, or exceptions.
- Write errors – This shows the number of errors that were made during the write process.
- Total transferred – The number of bytes received from the server.
- HTML transferred – The number of bytes received from the server that were from the document.
- Request per second – The mean number of requests the server processed per second. The value is determined by the total number of requests divided by the number of seconds it took to complete the requests.
- Time per request – The mean across all concurrent requests on how long it took per request.
- Transfer rate – This is the rate of transfer in kilobytes recived from the server per second.
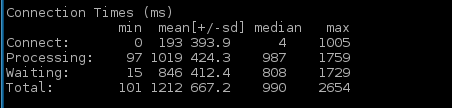
Apache BenchMark Connection Information
The third section details the overall connection time results presenting the minimum values, mean value, standard deviation, median, and maximum value:
- Connect – The amount of time it took to connect to the web server and return the first bits of a response.
- Processing – The amount of time it took the server to process a request.
- Waiting – How long it took for the first byte of data to be returned from a request.
- Total Time – How long it took to complete a request.
These values are in milliseconds. Again, note that there are 5 columns here:
- Minimum – The shortest amount of time taken.
- Mean – The average number of seconds per request.
- +/- sd – The standard deviation in milliseconds for the mean.
- Median – Median is the middle value of all requests. To get this value you would have to list all the result value in numerical order and find the middle number.
- Max – The maximum number of milliseconds a request took.
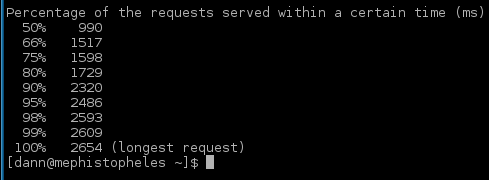
Apache BenchMark Percentages
The final bits of data report the “Percentage of requests served within a certain time.” These values are in milliseconds. In this example 50% of the requests completed in at the most 990 milliseconds. 90% of the requests completed in at the most 2320 milliseconds (about 2.3 seconds). All requests completed within 2654 milliseconds (2.6 seconds) which was the longest request time noted by the test.
Now that you have a basic understanding of how to interpret the results of the ab tool, let us return to covering some more of the switches.
The -k switch will turn on the KeepAlive feature. KeepAlive will keep the connection open between the webserver and the client to perform multiple requests within the same http session. The default for ab is to have this feature off and require a new connection for each request in the same session from the same client.
If you need to authenticate to the webserver to request the resource you can use the -A with like this:
-A username:password
The credentials are sent in base64 encoding. So be careful if you are not connecting to an secured channel.
You can run tests against https and if you need to specify the SSL/TLS protocol use the -f switch:
-f SSL2 | SSL3 | TLS1 | ALL
If you need to run your test through a proxy use the -X to define the proxy address and port:
-X proxy_ip:proxy_port
By default ab uses a GET request which returns the body of the document requested. You can switch to a HEAD request with the -i switch. A HEAD request will not return the body of the message, only the document headers, the meta-information.
You can sent POST and PUT information using the -p and -u switches respectively. Both of these switches require that a file with the POST or PUT contents be passed to the switch. Additionally, you must specify the content-type with the -T switch. The default content type is text/plain. For POST/PUT data you will probably want to set this to:
-T application/x-www-form-urlencoded
An example POST or PUT file might contain the following information:
name=dann&[email protected]&country=us
You can change the size of the TCP send and receive buffers with the -b switch and specifying a size in bytes:
You can run ab for a period of time as opposed to a number of request using the -t switch and specifying a number of seconds:
ab -t 10 http://www.thelinuxlink.net/index.php
This will run the benchmark for 10 seconds with the default concurrency of 1 request.
There are a few switches to control the output of the ab results:
- -d : Suppresses the percentage served information, the last block of data on the output.
- -q : Suppresses the progress output while ab is running.
- -S : Suppresses the median and standard deviation columns in the connection time results. This will also suppress the warning/error messages when teh average and median are more than one or two times the standard deviation apart.
- -v : The -v switch takes a number from 1 (default) to 4 for verbosity of debug information:
- 2 – Prints warnings
- 3 – Prints response codes
- 4 – Prints header information
The results of ab can be output in HTML table format with the -w switch:
ab -n 1000 -c 100 -w http://www.thelinuxlink.net/index.php
The output will be HTML code with the results after the percentage update in an HTML table. You can specify html formatting with the following switches:
- -x : table attributes: -x “width=200px”
- -y : tr attributes: -y “style=’text-align: center;’”
- -z : td attributes: -z “style=’color: red;’”
You will probably want to redirect the output to a file otherwise the code will just go to standard out:
ab -n 1000 -c 100 -w http://www.thelinuxlink.net/index.php > abresults.html
The ab command will generate a comma separated value file with the -e switch:
ab -e ab_results.csv -n 1000 -c 100 http://www.thelinuxlink.net/index.php
This will still display the progress on standard out. The resulting CSV file contains two values: A percentage from 0 to 99 and the time it took to serve that percentage or requests in milliseconds.
The -g option will output the results in a tab separated format that can be imported in applications like gnuplot, IDL, Mathematica, or a spread-sheet application like Libre-SpreadSheet:
ab -e ab_results.tsv -n 1000 -c 100 http://www.thelinuxlink.net/index.php
The Apache Benchmark tool is a handy application to have in your tool kit to not only perform cursory load tests on a web server but to stress the server to help identify intermittent problems. For more information check out these links:
- man ab
- Apache AB documentation
- Wikipedia Page: Apache BenchMark
- How to BenchMark or Stress Your Webserver
- StackOverflow – Definition of Connect, Processing, Waiting
- Explanation of Connect, Processing, Waiting
- W3C HTTP Protocol Method Definitions
- Purple Math – Mean, Mode, Median
- Wikipedia Page – Media Types
If the video is not clear enough view it off the YouTube website and select size 2 or full screen. Or download the video in Ogg Theora format:
- Episode 029 – ab – Apache BenchMark Ogg Theora Video – Archive.org
Thank you very much!
- Ogg file hosted by Hacker Public Radio
- Speex file hosted by Hacker Public Radio
- Mp3 file hosted by Hacker Public Radio